
There’s a moment in a lot of agency meetings where a chart goes up, the line points upward, and everyone nods. The client doesn’t want to admit they don’t know what the axis measures. The agency doesn’t volunteer it.
Nothing dishonest is happening. Both parties have just quietly agreed to skip the part where someone checks whether the number matters.
Here’s how to stop doing that, without needing to learn the whole discipline.
Ask what the number does when things go badly
This is the most useful question in any reporting meeting, and it works across every channel.
Impressions are up 40%. Fine. What would impressions do if this campaign were failing? Often the honest answer is: also go up, because impressions rise with indexation, seasonality and completely irrelevant search terms that happen to match a keyword.
A metric that only ever moves in one direction isn’t a measurement. It’s decoration.
Apply it broadly. Followers, reach, sessions, keyword count, pages indexed. If there’s no plausible version of the report where the number falls, the number isn’t carrying information.
The good version of this conversation is short. A capable marketer will say something like “yeah, impressions aren’t the interesting one this month, look at this instead.” That answer is worth more than the chart.
Split the report into money and everything else
You cannot deposit impressions. You cannot pay staff with reach.
Divide every report into two columns. On one side: enquiries, calls, form submissions, bookings, quote requests, sales. On the other: everything else.
The second column isn’t worthless. It’s diagnostic, and a good marketer uses it to explain why the first column moved or didn’t. But if a report is mostly the second column, someone is showing you the diagnostics because the outcome isn’t there yet.
Which is sometimes completely legitimate. Early campaigns genuinely do produce leading indicators before lagging ones, and demanding sales in month two is how good campaigns get killed. Just make sure that explanation is the one you’re being given, rather than one you supplied on their behalf while nodding at a chart.
Comparison periods can flatter
Up 30% on last month means very little if last month was January and you sell air conditioning.
Year on year is usually more honest than month on month for anything seasonal. And if a report only ever shows whichever comparison looks best, ask for the other one. A provider confident in the work will show both without being asked twice.
Watch for the moving baseline too. If the comparison period changes between reports, sometimes month on month, sometimes quarter on quarter, sometimes against launch, someone is selecting the frame each time. Pick one and stick to it.
Learn eight words, not eighty
Most business owners try to learn marketing vocabulary by reading a glossary end to end, get overwhelmed somewhere around the fourth acronym, and give up. Then they nod at charts for two years.
Better approach: write down the words that actually appeared in your last report and learn only those. It’ll be a handful. Impressions, clicks, click-through rate, conversions, sessions, and a couple of channel-specific ones.
That’s enough to hold a real conversation. You don’t need to know what canonicalisation means to run a business. You do need to know the difference between a click and a conversion, because that distinction is where most misunderstandings live and where most inflated reporting hides.
For the search side specifically, Sejuce Digital keeps a plain-English list of SEO terms every Sydney business owner should know that skips the jargon most glossaries pile on. Worth having open during a reporting call rather than trying to memorise beforehand.
Vanity metrics aren’t lies, they’re just early
Worth being fair to the people producing these reports. Impressions and reach aren’t invented, and they’re not always deployed to distract you.
Early in a campaign they’re often the only thing moving. A new page has to be crawled before it ranks, ranks before it gets clicked, and gets clicked a long time before anyone fills in a form. Showing you impressions in month two isn’t necessarily evasion, it’s sometimes the only honest evidence available.
The test is whether the emphasis shifts over time. Month two, leading indicators are reasonable. Month eight, if the conversation is still about reach, something has gone wrong and nobody wants to say it.
Ask directly: when should I expect to see this in enquiries? A specific answer creates a checkpoint you can both hold. A vague one is the answer.
Charts show movement, lists show work
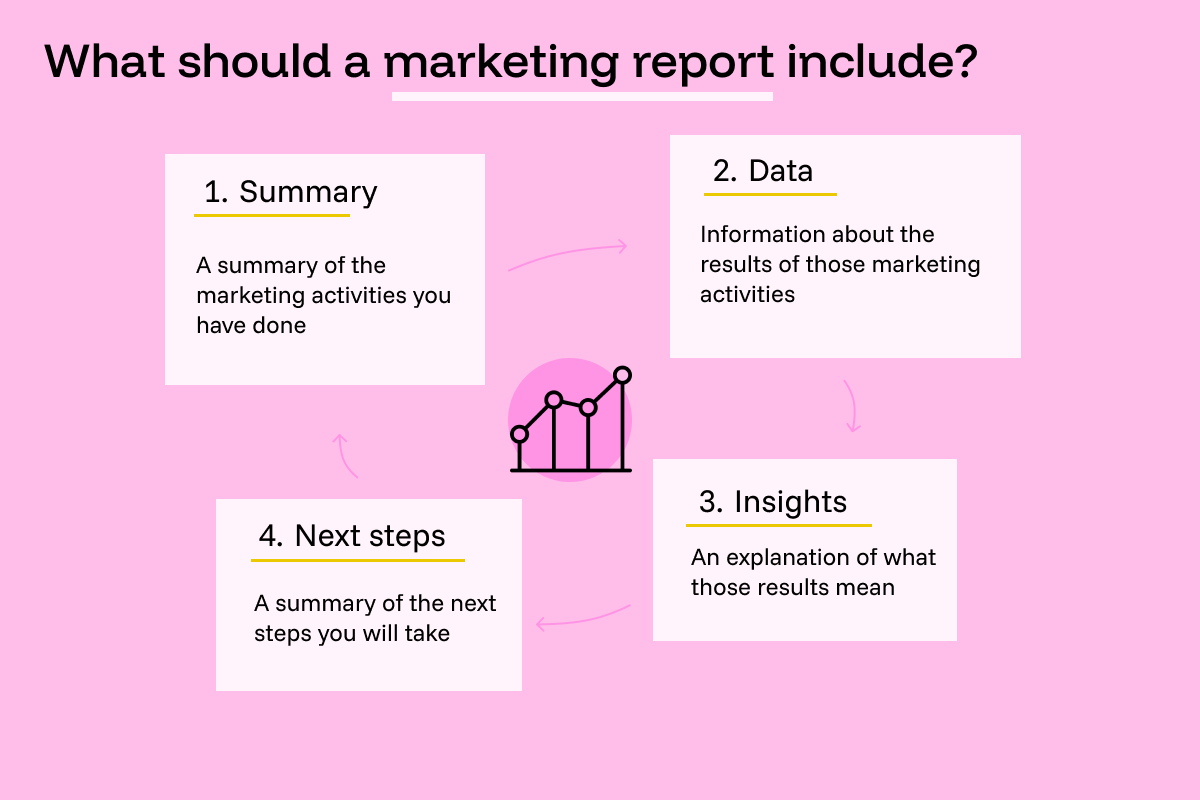
The most useful section of any marketing report is the one saying what was actually done that month. Pages changed, ads rewritten, listings updated, emails sent, content published.
If that section is missing, or it’s three bullet points of “ongoing optimisation and monitoring”, the report is describing weather rather than describing work.
You can’t hold anyone accountable for a graph. Too many variables, too little control. You can hold them accountable for a list, because the list is entirely within their control and it either exists or it doesn’t.
Ask for it in the format you’d want to read: date, what changed, where. Most providers already track this internally and simply don’t include it because they assume you’d find it boring.
Say when you don’t follow
The habit that improves reporting fastest is admitting confusion in the room.
“I don’t know what that means” costs you three seconds of mild awkwardness and permanently changes how the next eleven reports are written. Marketers pitch at the level they think you’re at. If you nod at jargon, you get more jargon.
The people worth working with will simplify without condescending, and some will be relieved. Explaining the work to someone paying attention is more satisfying than presenting to someone who’s mentally somewhere else.
The honest caveat
Some of what a good marketer does genuinely is hard to show in a monthly report. Foundational work has a lag. Technical fixes prevent problems you’ll never observe because they didn’t happen. Reasonable people disagree about what a given number means, and confident-sounding interpretations are often guesses with good posture.
But that’s an argument for asking more questions, not fewer. The reports that resist scrutiny are rarely the ones with good news buried in them.